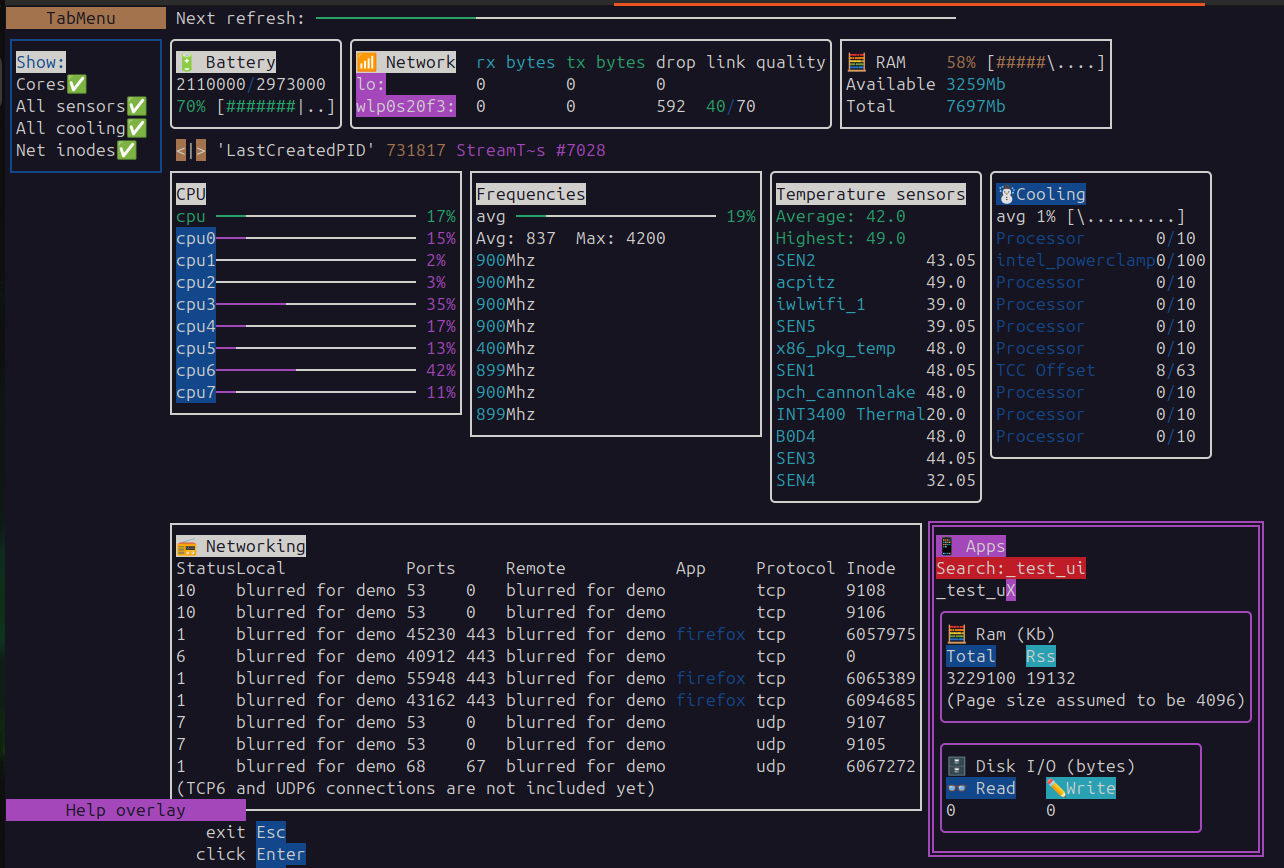
The app updates all of theses metrics every second and the values are shown on the ui.
Most of the elements on the screen also have an color that adapt to values,
and the goal is that it makes it easy to get an overview.
If you’d really want this GPU now, you can easily add an field to system_info,
just add some logic in the update_values method to update the field,
there is this run function that can return the value of an bash script for example !
I’ll try to prioritize the extension feature but need thinking !
app_progressive
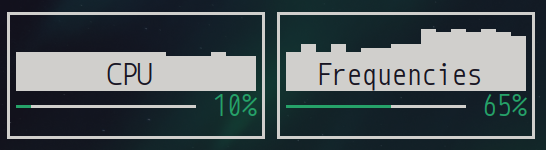
More user-friendly, progressive complexity, “Things shown only when needed”.
This is what the ui framework should be able to to more and better over time.
Ever feel like me not knowing how to learn all thoses useful linux based OS stats ?
That’s exactly why this exist and turns out there is an way to turn complexity into clarity,
and i think i’m starting to understand how and why to do that.
Very pleased, see README.md to get started with the app_progressive version.
Interestingly, there is no need for how-to’s!
I think this is working! Any feedbacks ?
Hi, just added an GPU metric pannel,
and an customizable metric fetcher for it: Dummy_GPU_metric_fetcher.mojo by default, the fetcher returns dummy data.
See README.md,
it is just an function that has to return an String of formatted CSV data.
(that is all the ui care about)
All needed for an user is to create an shell script (in tmpfs if possible to not do disk i/o) , run it in the fetcher to get the return, format the data to the specified CSV format,
and return the String from the fetcher for the ui.
If your gpu have an tool,
maybe it returns JSON or CSV depending on the brand i guess.
Some gpu’s might only have virtual files to read and no tools,
so Path.read_* can be done in mojo for theses.
It should also possible to use an pip for that since mojo have PythonObject.
As explained in the readme and fetcher, it is up to the user to customize the fetcher:
get metrics
parse metrics if needed
hand the metrics to the app in an specific CSV format.
Even remote GPU’s will be supported that way with async later on.
Please don’t PR any solutions that bring external tools,
as good as they are, there are many many GPU’s.
What is needed is an unified metric format.
I hope this GPU pannel will really help people that asked for an GPU metrics pannel in their app.
Did my job so that the app can consume an specific CSV format,
and show the data regardless of what it is or where it comes from.
In fact, i don’t even have, use or need an GPU lol this is for y’all !
Things are taking shape!
The ui is able to fetch only the selected columns,
and when needed, only the rows “really” on the screen!
Many new features, an 16 period network-card widget,
controls that appears only when hovering an area,
“advanced” stats available as columns like Swap and ContextSwitch.
Everything got done with the vanilla ui-framework,
it might be more capable that what i thought